Theory-based inference
Alongside the simulation grammar, moderndive ships tidy wrappers for the
classical (formula-based) tests and a way to draw the theoretical distributions —
mirroring R infer’s t_test, prop_test, chisq_test, and assume().
One-line tests
import moderndive as md
from moderndive import t_test, prop_test, chisq_test

# One-sample t-test
age = md.load_age_at_marriage()
t_test(age, response="age", mu=23)
# → statistic, t_df, p_value, alternative, estimate, lower_ci, upper_ci

# Two-sample (Welch) t-test
movies = md.load_movies_sample()
t_test(movies, formula="rating ~ genre", order=("Action", "Romance"))

# Two-proportion z-test
yawn = md.load_mythbusters_yawn()
prop_test(yawn, formula="yawn ~ group", success="yes", order=("seed", "control"))

# Chi-squared test of independence
chisq_test(yawn, formula="yawn ~ group")
# → statistic, chisq_df, p_value
shape: (1, 3)
| statistic | chisq_df | p_value |
|---|---|---|
| f64 | i64 | f64 |
| 0.105042 | 1 | 0.745861 |
t_stat and chisq_stat return just the test statistic if that’s all you need.
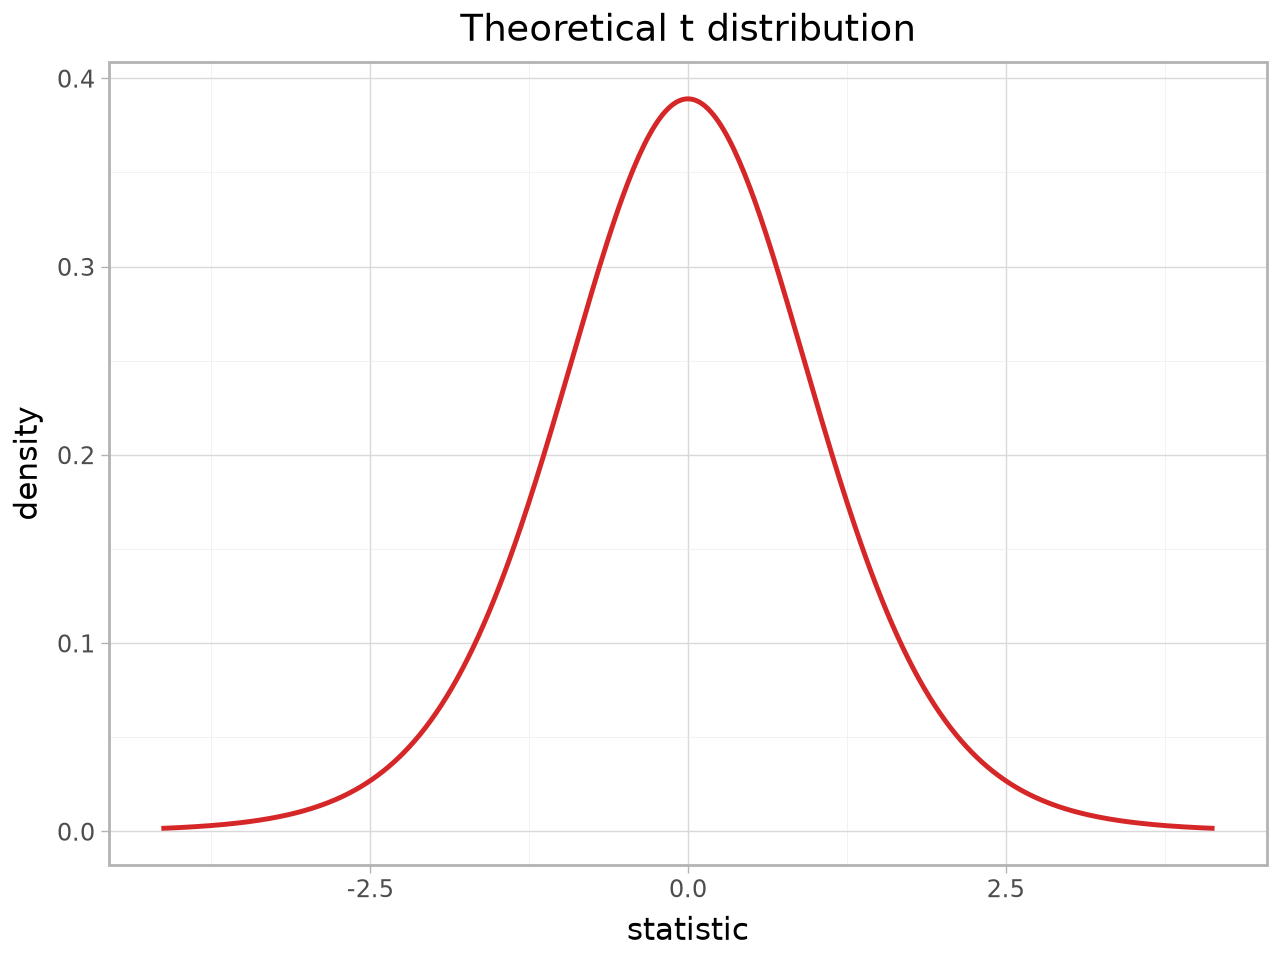
Theoretical distributions with assume()
assume() defines a theoretical sampling distribution you can visualize and use
for p-values without simulating:
from moderndive import assume

# t-distribution with 10 degrees of freedom
t_dist = assume("t", df=10)
t_dist.get_p_value(2.0, direction="right")     # one-sided p-value

# plotly by default; engine="plotnine" for ggplot output
t_dist.visualize()
t_dist.visualize(engine="plotnine")
Supported distributions: "t", "z", "F" (pass df=(df1, df2)), and
"Chisq".
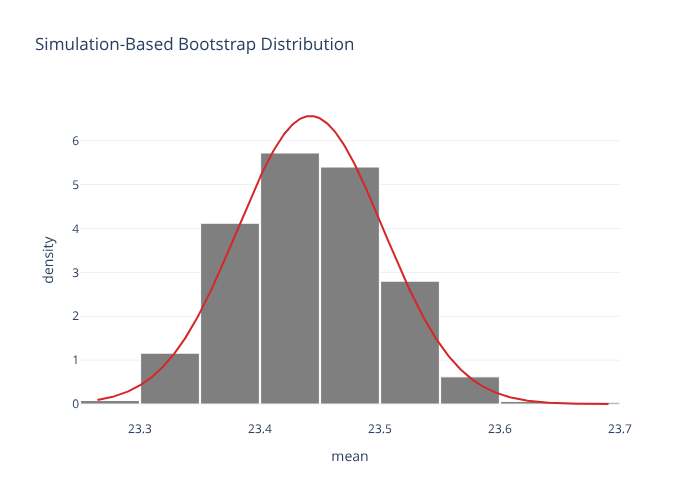
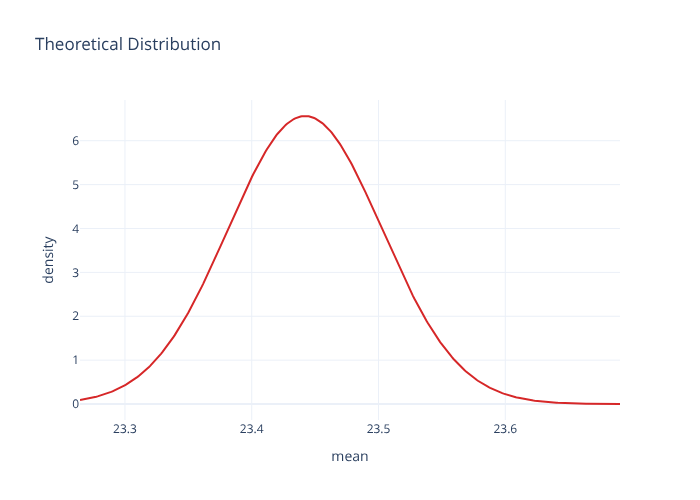
Overlaying theory on a simulation
visualize(..., method=...) can show the simulation histogram, the theoretical
curve, or both:
from moderndive import visualize

boot = (
    age.specify(response="age")
    .generate(reps=1000, type="bootstrap", seed=1)
    .calculate(stat="mean")
)

visualize(boot, method="both")          # histogram + normal-approximation curve
visualize(boot, method="theoretical") # just the curve
Population standard deviation
A small helper that divides by n (not n − 1):
from moderndive import pop_sd

pop_sd([1, 2, 3, 4, 5])   # → 1.414…
1.4142135623730951